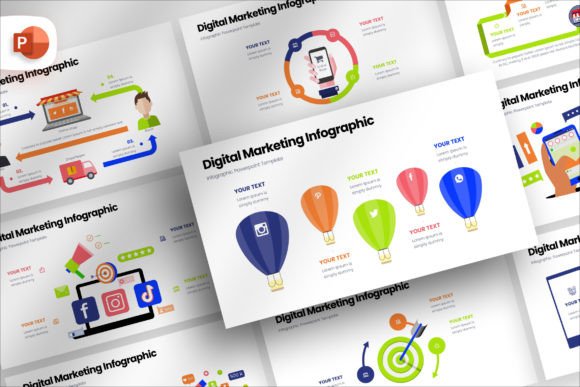
Digital Marketing Infographic Template: Elevate Your Presentations
You have sat through enough mediocre presentations to know what does not work. Cluttered slides, inconsistent fonts, and generic layouts that scream "I downloaded this in 2015." The audience checks their phones before you reach slide three. But here is the thing—your content deserves better, and so do the people watching you deliver it. The Digital Marketing Infographic Template exists to fix that exact problem. It is not just a set of slides. It is a visual system designed to help you communicate complex marketing data, campaign results, and strategic ideas without making people work to understand them.
What Makes This Template Different Visually
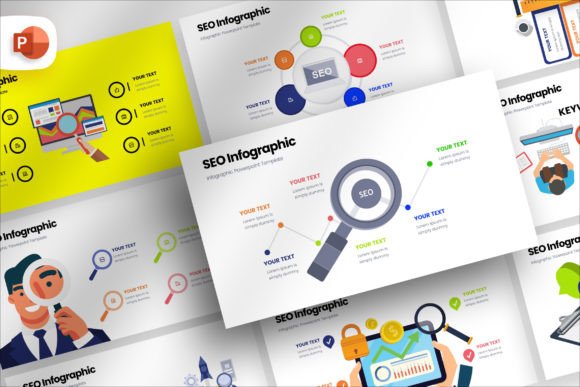
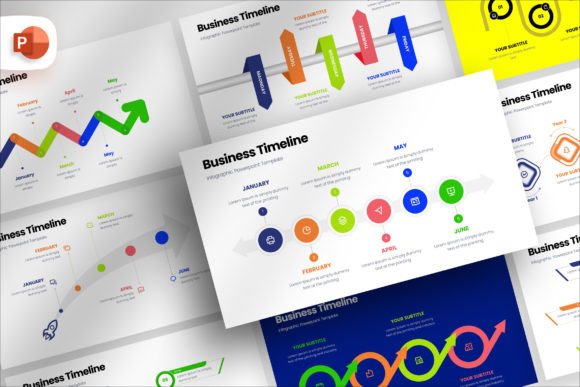
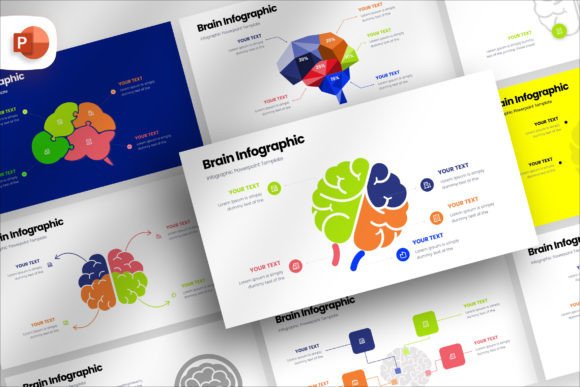
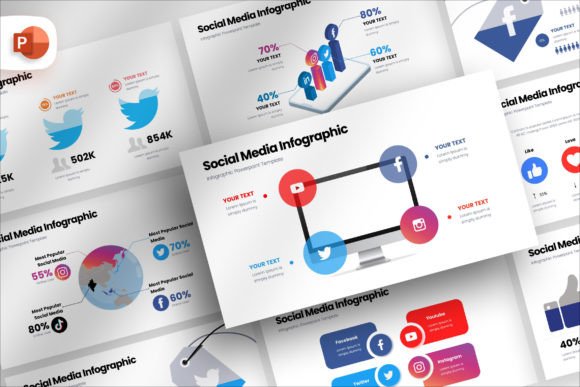
At first glance, the Digital Marketing Infographic Template feels clean and intentional. The 16:9 aspect ratio means every slide fits modern screens without awkward cropping or letterboxing. But the real strength lies in what you cannot see immediately—the drag-and-drop picture placeholders that auto-adjust size, transparency, and shape. You drop an image in, and the template handles the rest. No fiddling with alignment guides or manual resizing. That matters when you are under a deadline and need to move fast.
The personality here is professional without being cold. It leans toward modern typography with generous white space, making each slide feel airy rather than jammed. Color palettes are flexible but naturally lean toward branding-friendly tones—think muted backgrounds with bold accent colors for data points and callouts. The overall style works for both internal team meetings and client-facing presentations, which is harder to pull off than most people realize. Many templates force you into either "casual team update" or "formal boardroom" territory. This one straddles both comfortably.
Where This Template Shines Across Projects
Digital Marketing Infographic Presentation Template works across more contexts than you might expect. Yes, it is built for marketing presentations—campaign recaps, content strategies, social media audits, and funnel analysis. But the structure translates well into other areas. I have seen small business owners repurpose these slides for investor pitch decks, internal training materials, and even simple e-book layouts. The visual consistency makes your work look intentional even if you threw the deck together in an afternoon.
For bloggers and content creators, this template becomes a shortcut to creating social media graphics that actually hold together as a set. Instead of designing each Instagram carousel post from scratch, you maintain the same visual language across every slide. Your audience starts recognizing your style before they even read the caption. That is brand recognition happening organically, which is exactly what you want.
Print applications work too. The template's layout structure translates well into brochures, one-pagers, and printed reports. Just ensure your print shop handles the resolution correctly, and you have a consistent brand experience across digital and physical touchpoints. For crafters and hobbyists running small shops, this means product catalogs, lookbooks, and even simple zines that look professionally produced without hiring a designer.
How It Influences Readability and Audience Engagement
Readability starts before anyone reads a single word. It begins with how the eye moves across the slide. The Digital Marketing Infographic Template uses visual hierarchy naturally—headlines sit at consistent positions, supporting data follows logical flow, and callout boxes draw attention to key numbers without shouting. You do not have to think about where to place things because the template already solved that problem for you.
Brand perception improves significantly when your presentations look cohesive. Imagine showing a client a campaign report where every slide uses the same headline style, same icon treatment, and same data visualization approach. They stop focusing on the format and start focusing on the results. That shift is subtle but powerful. It signals that you care about details, which makes people trust your numbers more. Whether you use a sans serif font or a serif font for body text, the template keeps everything consistent so your message stays front and center.
Audience engagement often comes down to how easy you make it for people to follow along. When slides are cluttered, your audience splits attention between listening to you and decoding the slide. This template removes that friction. The layout guides the eye naturally, so people absorb information faster and return their attention to you sooner. That is the difference between a presentation people endure and one they actually learn from.
Evaluating Whether It Fits Your Project
Before you commit, ask yourself what kind of content you are presenting. If your slides are text-heavy—long paragraphs, dense reports, detailed case studies—this template still works, but you will want to use the headline and callout features to break up the reading experience. If your content is data-heavy with charts, graphs, and metrics, this template is almost ideal because the infographic elements give you natural places to highlight key figures.
Consider your audience too. Internal teams might tolerate simpler layouts, but external clients expect polish. The Digital Marketing Infographic Template leans toward the polished end of the spectrum without feeling over-designed. If your brand identity leans minimalist, you can remove decorative elements and let the grid system carry the weight. If your brand is bold and colorful, you can push the accent colors further. The template adapts because the underlying structure is solid.
Font Pairing and Readability Considerations
Font choice matters more in presentations than in almost any other medium because people are reading from a distance. The Digital Marketing Infographic Template works well with both serif font and sans serif font options, but readability testing on a projector is worth your time. I lean toward modern typography for headlines—something with clean lines and distinctive character shapes—paired with a neutral sans serif font for body text. The template includes font recommendations in the documentation, but do not feel locked in. Test your pairings on an actual screen at the size you will present.
Avoid handwritten font styles for body text in presentations. They look charming on packaging or social media graphics but become hard to read at projection sizes. If you want to use a script font or handwritten font, reserve it for short headings or accent words only. Similarly, a display font can work for title slides, but the template's strength is consistency, so limit decorative fonts to one or two places per deck.
Licensing and Practical Setup
The package includes 72 unique slides, a documentation file, and mockup devices with drag-and-drop screen placeholders. The font license is free, which removes one common headache. However, note that image stocks are not included. You will need to source your own photography or illustrations. This actually gives you more control over the final look rather than being stuck with stock images everyone else uses.
When setting up your slides, start with the mockup device slides if you plan to show website screenshots or app interfaces. The drag-and-drop placeholder makes it easy to swap in your own screen captures without worrying about perspective or alignment. For the remaining slides, focus on populating the data visualizations first—bar charts, comparison tables, and timeline graphics—then layer in supporting text. The template's commercial font licensing means you can use it in client work without legal concerns, which is always a relief when delivering final files.
Design Observations and Realistic Recommendations
One thing I notice repeatedly with presentation templates is that people try to use every slide type in one deck. Resist that urge. The 72 unique slides are options, not requirements. Pick the layouts that serve your content and skip the rest. A focused 12-slide deck using a consistent subset of the template will always outperform a sprawling 40-slide deck that uses everything available.
For logo design and brand identity work, the template's clean grid system can double as a mood board framework. Drop your brand elements into the placeholder slides to test how they look together before committing to a final direction. This is a low-stakes way to evaluate design assets against each other.
For editorial design and packaging design applications, the infographic elements translate well into print collateral. The same visual systems that guide viewers through a presentation can guide them through a brochure or product sheet. Just adjust the aspect ratio if you are moving to print—the 16:9 format is optimized for screens, but many of the layout principles carry over with minor tweaks.
If you work in web design or create social media graphics regularly, consider using the template as a starting point for visual consistency across platforms. Pull the color palette, headline hierarchy, and icon style into your Canva or Figma projects. The template becomes less of a one-time tool and more of a visual foundation you reference across your entire content operation.
The Digital Marketing Infographic Template is not going to design your presentation for you. You still need to think about your story, your audience, and your data. But it removes the friction of layout decisions so you can focus on what actually matters. That is the kind of tool worth keeping in your back pocket for every campaign recap, strategy pitch, and quarterly review that comes your way.