Infographic Vertical Rectangle: A Versatile Design Template
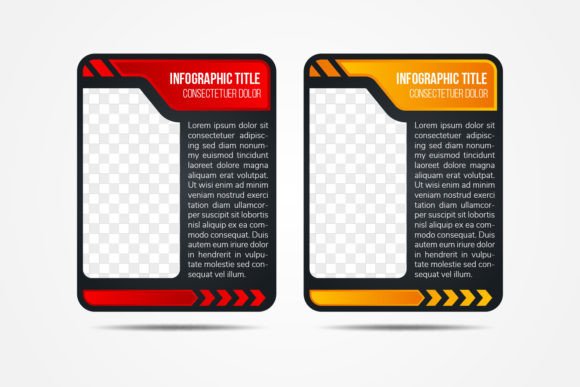
If you’ve ever had to visually summarize a company overview, product launch, or annual report in a single page, you know how hard it is to balance content and aesthetics. The Infographic Vertical Rectangle template takes the guesswork out of that process. It’s a vector-based infographic layout built around a clean vertical structure, four gradient color blocks, and a black background that makes your content pop. Designed at 300dpi with fully editable text, shapes, and colors, this template gives designers, marketers, and small business owners a fast, professional starting point for creating polished infographics without starting from scratch.
Visual Characteristics and Design Appeal
The Infographic Vertical Rectangle stands out for its deliberate simplicity. The template uses a black backdrop that instantly adds depth and contrast. Four carefully selected gradient blocks create a natural flow down the page, each block acting as a distinct section for data points, copy, or imagery. Rectangular photo placeholders are integrated directly into the layout, so you can drop in team photos, product shots, or icons without worrying about alignment. The spacing between elements feels generous, not cramped, and the overall style leans modern but not trendy—it won’t look dated after a year or two.
Because everything is 100% vector, scaling the template for a poster, a digital banner, or a printed booklet is seamless. The 300dpi resolution ensures your print materials stay crisp, while the vector files let you tweak every corner and curve. The design personality is professional with a touch of creative energy—those gradient blocks avoid flat corporate sterility but never scream for attention. That balance makes the template flexible enough for both internal presentations and client-facing materials.
Where This Template Works Best
The Infographic Vertical Rectangle was built with a specific vertical format that lends itself naturally to a range of projects. Here are the applications where it really shines:
- Company overview profiles – present mission, vision, key metrics, and team photos in a single, scannable page.
- Corporate brochures and booklets – use the template as a base spread, then duplicate pages to build a longer document with consistent branding.
- Presentation slides – export single infographics as high-res JPGs or SVGs to embed in decks, keeping your visuals consistent across PowerPoint or Keynote.
- Social media graphics – the vertical layout is a natural match for Instagram Stories, LinkedIn carousels, and Pinterest pins.
- Print marketing – from event programs to poster-sized annual summaries, the 300dpi resolution and CMYK-friendly gradients print beautifully.
- Website banners and landing page modules – slice sections of the infographic into horizontally scannable blocks if needed, or use the full template as a hero graphic.
The template’s dark background works especially well for finance, tech, and creative agencies that want to project a sleek, confident brand identity. But don’t hesitate to lighten the gradient stops—since every color is editable, you can shift the mood to bright pastels or warm earth tones in minutes.
How the Template Influences Readability, Hierarchy, and Brand Perception
Good information design relies on clear hierarchy, and the Infographic Vertical Rectangle enforces that without extra effort. The gradient blocks naturally separate content sections, guiding the reader’s eye from top to bottom. The black background provides maximum contrast for white or light-colored text, so your headlines and key numbers stand out immediately. Photo placeholders are placed in context with adjacent text blocks, making it obvious which image relates to which statistic or bullet point.
From a brand perspective, using a consistent template like this across multiple materials builds recognition. When clients or stakeholders see the same structured layout in a proposal, a one-pager, and a web banner, they begin to associate your organization with clarity and professionalism. The Infographic Vertical Rectangle avoids design gimmicks, so the focus stays on your message—this is especially important for complex data that might otherwise get lost in a busy layout.
The editable nature means you can fine-tune hierarchy further: adjust font sizes, make certain blocks larger, or change the gradient direction to emphasize a particular section. That level of control helps you maintain readability even when working with long bullet lists or multi-sentence paragraphs.
Practical Guidance for Choosing and Using This Template
Before you start customizing, take a moment to evaluate whether the Infographic Vertical Rectangle fits your specific project. Ask yourself these questions:
- Content volume – Can your information be organized into four main sections? If you have more, you can duplicate a block and adjust sizes, but the template really shines with a moderate amount of content per page.
- Visual priorities – Do you have at least two or three strong photos to fill the placeholders? The template expects visual anchors, so avoid using it for text-heavy reports that lack imagery.
- Brand colors – Your existing palette likely works with the gradient concept, but test a few variations. The template’s gradients are pre-made, but you can replace them with your own color stops directly in Illustrator or other vector software.
- Audience expectations – A corporate board might prefer more conservative gradients, while a creative team will embrace bold transitions. Since the gradients are fully editable, you can satisfy both extremes with the same base layout.
Once you’ve confirmed a fit, download the entire package—you’ll get Ai, EPS, JPG, and SVG formats. Open the .ai or .eps file to access every editable vector object. Change placeholder text to your copy, swap in your photos, and adjust gradient colors using your brand hex values. The SVG is great for web use, while the JPG works well for quick previews or social sharing. Remember that all graphics are 100% vector and well organized in layers, so you can hide, lock, or rearrange elements without messing up the structure.
Real-World Example: Startup Pitch Deck One-Pager
Imagine you’re helping a fintech startup prepare an investor one-pager. You open the Infographic Vertical Rectangle template and assign each gradient block to: “Problem” (with a small bar chart), “Solution” (with a product screenshot placeholder), “Market Size” (a large number plus a citation text block), and “Team” (headshots). The black background makes the revenue numbers feel premium. You swap the gradients from bright blue-purple to a more subdued navy-teal to match their existing branding. Within an hour, you’ve produced a ready-to-print infographic that looks like it cost ten times more than the template price.
Why This Template Is a Smart Investment for Creators
The Infographic Vertical Rectangle belongs in the toolkit of anyone who regularly designs marketing collateral, corporate materials, or content previews. It’s not a one-trick pony—because the layout is fundamentally simple, you can rework it for different topics just by changing colors, images, and text. The included formats (Ai, EPS, JPG, SVG) ensure you can collaborate with team members who use different software, and the 300dpi resolution means you’ll never be caught with a pixelated print run.
If you have questions about customizing a specific gradient or resizing the template for a non-standard format, don’t hesitate to reach out. The template is designed to be intuitive, but sometimes a small tweak can make a big difference. Thank you for choosing this product—I wish you a good day and look forward to seeing how you make it your own.
Please contact me if you have any questions during your project.