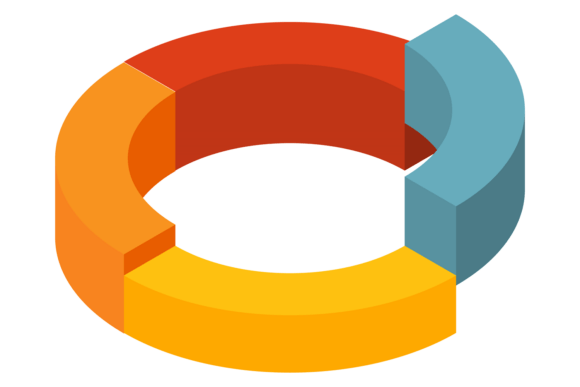
Ring Diagram: Isometric Infographic Chart Explained
A ring diagram, often paired with an isometric infographic chart, is a visual tool that presents data in a circular, segmented format with a hollow center, rendered with three-dimensional depth to create a sense of space and perspective. Unlike flat pie charts or basic donut graphs, the isometric twist adds angular dimension, making each segment appear to pop off the page or screen. This style of visualization sits at the intersection of design, data communication, and practical storytelling — and it matters differently depending on who is looking at it.
For some, a ring diagram is primarily about clarity. For others, it is about visual impact. And for a growing number of creators and professionals, it represents a bridge between raw numbers and compelling presentations. Understanding what this chart type offers — and what it demands from its user — can help you decide whether it fits your next project, report, or creative brief.
What makes a ring diagram different from other charts
A ring diagram shows parts of a whole, much like a pie chart, but removes the center to emphasize the segments along the ring. When you add an isometric view, the chart gains a tilted, three-dimensional appearance that mimics how objects look in physical space. This combination makes the visualization feel more like an illustration than a conventional graph. The isometric angle allows each segment to carry visual weight through depth, shading, and perspective.
This format works especially well when you want to highlight proportions without overwhelming a viewer with flat slices. The hollow center can also hold a central label, icon, or summary number, turning the chart into a self-contained visual anchor. Beginners often find ring diagrams more approachable than complex multi-axis graphs, while experienced creators appreciate the extra creative control that the isometric style provides.
Why different audiences reach for this chart type
The value of a ring diagram with isometric styling shifts depending on who you are and what you need to accomplish. Here is how several common user groups might approach it.
Beginners and hobbyists exploring data visualization
If you are new to presenting data, a ring diagram feels less intimidating than a stacked bar chart or a scatter plot. The circular format is familiar, and the isometric effect adds a polished look without requiring advanced design skills. You might use a template from a presentation tool or an infographic maker to create your first ring diagram for a school project, a club budget, or a personal hobby tracker. For you, ease of use and speed matter most. You want something that looks good quickly, without a steep learning curve. A well-designed isometric ring chart can make your work stand out even when your data set is small.
One practical example: a hobbyist tracking monthly gardening expenses could show how much goes to seeds, soil, tools, and water. The ring format makes each category visually distinct, and the isometric depth adds a tactile quality that feels more engaging than a standard spreadsheet.
Creators and designers building visual stories
For creators — whether you make social media graphics, slide decks, or editorial illustrations — a ring diagram with isometric perspective becomes a design element, not just a chart. You care about flexibility, quality, and creative control. You may customize colors, shading, segment angles, and the center graphic to match a brand palette or a narrative tone. The isometric angle lets you integrate the chart into broader illustrations, dashboards, or infographic layouts where flat charts might feel disconnected.
You might evaluate a ring diagram template based on how editable it is. Can you adjust the tilt? Can you swap the center icon? Does the shading update automatically when you change segment values? For a creator, the difference between a static image and a layered, editable file can determine whether the chart becomes a reusable asset or a one-time graphic. A freelancer designing an annual impact report for a nonprofit, for example, might use an isometric ring diagram to show how donor funds are distributed, with each segment color-coded to a program area and the center holding the total raised.
Professionals and business owners presenting to stakeholders
When you present to clients, executives, or board members, presentation and commercial value become top priorities. A ring diagram with isometric rendering signals attention to detail. It suggests that you invested time in making data not just readable but memorable. Business owners often use these charts in pitch decks, quarterly reviews, or marketing reports to illustrate market share, revenue breakdowns, or resource allocation.
The isometric style helps your chart hold its own in a printed report or a projected slide. Unlike flat graphs that can look washed out on large screens or in PDFs, the dimensional shading maintains contrast and visual interest. For a small business owner presenting a new product line, a ring diagram could show the percentage of budget dedicated to development, manufacturing, marketing, and distribution. The center could hold the product name or launch quarter, creating a clean focal point.
However, professionals also need reliability. The chart must accurately represent the underlying data without distortion. Isometric effects can sometimes exaggerate or obscure proportions if not carefully applied. You need to verify that the visual depth does not mislead your audience — a common concern with any 3D chart style. A responsible approach is to pair the ring diagram with explicit percentage labels or a complementary table when precision is critical.
Educators and trainers teaching data literacy
If you teach others how to read or create charts, a ring diagram offers a gentle entry point into proportional data. You might use it to explain the concept of parts of a whole before moving to more complex forms like stacked area charts or treemaps. The isometric version adds a layer of visual interest that can capture attention in a classroom or workshop setting. You value learning value and clarity above all.
You could ask students to compare a flat pie chart with an isometric ring diagram of the same data, then discuss how perspective changes perception. This exercise builds critical thinking about visual honesty and design choices. For an educator, the chart is not just a tool for showing numbers — it is a teaching moment about how form influences understanding.
Key considerations before choosing a ring diagram with isometric styling
No single chart type fits every situation. The ring diagram with isometric perspective works best when you want to combine visual appeal with proportional data. But it is not always the optimal choice. Here are several factors to weigh based on your role and goals.
Data complexity and segment count
Ring diagrams handle a small to moderate number of segments well. If you have more than six or seven categories, the segments become thin and harder to distinguish, especially with isometric shading. Beginners and hobbyists should keep segment counts low — four or five is ideal. Professionals working with more categories might consider grouping smaller segments or using an alternative chart type. The isometric effect amplifies visual clutter, so simplicity pays off.
Format and output medium
Where will your chart live? On a website, a printed poster, a slide, or a social media post? The isometric ring diagram performs well in high-resolution digital and print formats where shading and perspective can be appreciated. On small mobile screens, detailed isometric shading might lose impact. Creators and business owners should test their charts at the actual display size. A chart that looks stunning on a 27-inch monitor may appear muddy on a phone if the segments are too thin or the colors too similar.
Customization effort versus ready-made assets
Your willingness to customize affects which tools or templates you choose. Beginners often prefer drag-and-drop editors with pre-built isometric ring chart options. Creators and freelancers may want vector files (such as EPS) that allow deep editing of every element — shading angles, segment thickness, center graphics, and background treatment. Business owners may compromise: they want a professional look but need to produce it quickly. A high-quality template that balances polish with easy data entry can save hours.
The original request mentions EPS and JPG formats. EPS gives you scalable vector control, ideal for print and large displays, while JPG works for quick digital use. If long-term usefulness matters to you, choose vector-based files that you can modify later as your data changes.
Practical examples by audience need
- A blogger creating an annual review post: Use a ring diagram to show how your audience grew across platforms. The isometric angle adds visual interest to an otherwise text-heavy page. Keep the center graphic as a year label.
- A freelancer pitching a brand strategy: Show the breakdown of a proposed budget using a ring diagram in your proposal deck. The dimensional look signals professionalism and helps your client grasp distribution at a glance.
- A small business owner reviewing operational costs: Map expenses into four or five categories. The hollow center can hold a key metric like total monthly spend. Use this chart in internal reviews to foster discussion about resource allocation.
- An educator designing a workshop handout: Create a simple ring diagram showing a familiar breakdown — for example, how a day is spent across work, sleep, leisure, and chores. The isometric style makes the handout feel modern and approachable.
- A hobbyist documenting a personal project: Track where your time or money went during a renovation, a trip, or a creative challenge. The chart becomes a visual summary you can share with friends or look back on for your own reflection.
Deciding if this chart type matches your needs
Ask yourself a few direct questions before committing to a ring diagram with isometric styling. Do you have two to six categories that add up to a meaningful whole? Do you need a visual that draws attention and communicates proportion quickly? Are you working in a medium where depth and shading will be visible and appreciated? If you answered yes to these, the ring diagram is a strong candidate.
If your primary need is raw precision, massive data sets, or rapid iteration without any design input, a simpler chart type may serve you better. The ring diagram with isometric perspective is not a universal tool — it is a specialized one. It excels when you value presentation, storytelling, and audience engagement alongside the numbers.
For the cost-conscious beginner, free or low-cost templates are widely available. For the demanding professional, premium vector assets or custom-built charts may be worth the investment. For the educator, the chart itself can be a learning object. And for the creator, it is an opportunity to blend data with design in a way that feels fresh and intentional.
Ring diagrams with isometric infographic styling have carved out a space where data meets craft. Whether you are assembling your first report or refining your hundredth, this chart type offers a distinctive way to show proportions without blending into the background. The key is matching its strengths to your actual context — your data, your audience, your medium, and your own comfort level. When those align, the ring diagram becomes more than a chart. It becomes a clear, memorable part of your communication.