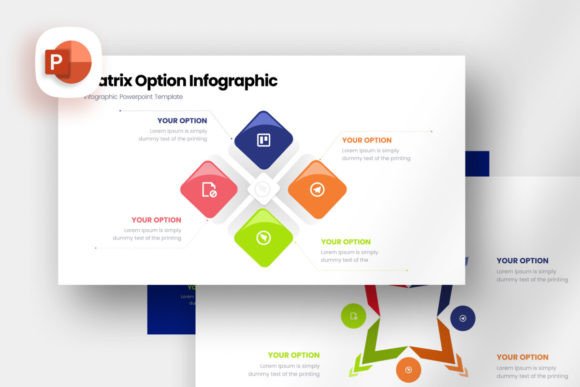
Matrix Option Infographic Presentation: Turning a Great Template into a Great Presentation
You have a big idea, four different approaches, and one shot to get your team or client on board. The typical slide just won't cut it. That is where a tool like the Matrix Option Infographic Presentation comes into play. It promises structure, clarity, and a professional look. But a template is only as good as the person using it. I have watched brilliant entrepreneurs and seasoned marketers buy premium assets like this only to end up with slides that feel cluttered, confusing, or just plain boring. The issue wasn't the tool. It was how they approached it. Let's walk through the common missteps people make with this specific type of presentation template and, more importantly, how you can avoid them.
The Matrix Option Infographic - Presentation Template is built to simplify complex comparisons. With 25 slides, vector shapes, and a full HD ratio, it gives you a massive head start. However, if you treat it like a magical fix that requires no strategic thinking, you will waste the potential. Let's get into the practical corrections that will make your work stand out.
Treating the Matrix Option Infographic Presentation Like a Data Dump
This is the single most common mistake. A person has four business options or strategies. They open the template. They dump bullet points into each quadrant. They call it a day. What they have created is a list inside a box, which defeats the entire purpose of a matrix.
The power of a matrix lies in positioning. An item in the top-right quadrant should signal something different than an item in the bottom-left. If you are just listing features without leveraging the axes (e.g., High Cost vs. Low Effort, High Value vs. Low Risk), you are missing the point.
The better approach: Before you open the file, define your axes. What are the two competing variables that your audience cares about? Once you have that, use the matrix to plot your options. The visual placement will immediately communicate why one option is better than another. This is where the template's design does the heavy lifting for you.
Ignoring the Vector and Master Slide Power
Another oversight I see frequently is people treating this template like a static PDF. They right-click every single element to change its color, or they stretch an icon and wonder why it looks blurry. The documentation clearly states that all elements are vectors. This is a feature you should be excited about.
Vectors mean no pixelation. You can resize a shape from a tiny badge to a full-screen background, and it will remain crisp. But the real time-saver here is the Master Slide. If you manually change the color of a circle on slide 3, you have to do it again on slide 12. That is inefficient.
How to use it wisely: Go to the Slide Master view immediately. Change the global color palette to match your brand. Change the default fonts. This one action will apply the change across all 25 slides in seconds. It ensures consistency and saves you hours of tedious work. When the template says "Full Easy Editable," it means the structure is designed for you to make wholesale changes with minimal clicks. Respect that design.
Misunderstanding the "Matrix" Format for Your Content
Not every topic belongs in a 2x2 grid. A common disappointment happens when someone tries to fit a linear step-by-step process or a simple list into a matrix format. The result is confusing. The audience spends their mental energy trying to figure out why it is in a box rather than absorbing the message.
You should check your content against the structure of the template. The Matrix Option Infographic Presentation excels when you need to compare items based on two conflicting criteria. Think of it as a map. If you just need to list pros and cons, a simple table works better. But if you need to show where a competitor sits in terms of "Market Power" vs. "Innovation," this format is perfect.
Practical check: Ask yourself, "Does the position of this item in the box change the meaning?" If the answer is no, you might be using the wrong template. If the answer is yes, you are about to create a very powerful slide. Do not force the data to fit the graphic; let the graphic serve the data.
The 16:9 HD Canvas Trap
The template offers a full responsive 16x9 HD ratio display. This is a gift. It works perfectly on modern screens and projectors. But I often see people treat this spacious canvas as an invitation to add more content. They scale up the graphics and fill the empty space with tiny text and clip art.
This kills the "Infographic" aspect of the template. An infographic is meant to be scannable. It guides the eye. If you overcrowd the slide, you lose the hierarchy.
Apply the rule of thirds: Use the space to create breathing room. The vector shapes will already provide structure. Use the "Drag and Drop to Upload Images" feature to place large, high-impact visuals that support your point. Let the slides breathe. A clean, well-spaced matrix communicates confidence and clarity. A cluttered one communicates anxiety and confusion. Trust the empty space.
Building Slides Instead of a Narrative
The template includes 25 slides. Most people see this as a chore to fill. They try to put everything they know into the deck. The result is a presentation that covers every angle but leads nowhere. This is the difference between data and narrative.
A great presentation is a journey. You have 25 slides at your disposal. Use the first 5 to set up the problem. Use the next 5 to explain the criteria for the matrix. Then, reveal the matrix itself. Reveal one quadrant at a time. This builds suspense and allows you to control the conversation.
Professional workflow: Use the first few slides to define the "Option" problem. The Matrix Option is the solution. Don't show the solution until your audience understands the question. This makes your final slide, where you show the complete matrix with your recommendation, feel like a brilliant conclusion rather than a confusing starting point. You are not just presenting a template; you are leading a discussion.
What to Verify Before You Begin
Before you get deep into editing, do a quick audit of your assets. The template uses a free font. Download and install it before you open the file. If you don't, the layout might break, and you will spend time fixing alignment issues that were already solved for you.
Also note that stock photos are not included. This is standard, but it catches people off guard. Do not use low-resolution images or random web graphics. They will look terrible on the HD canvas. Plan your images. Use high-quality, royalty-free stock photo sites. The "creative professional work" look comes from the combination of the vector template and high-quality photos.
Finally, read the included documentation. It is not filler. The documentation explains how the master slides work, how to upload images, and how to change colors efficiently. Skipping this step is like ignoring the instructions for a piece of furniture and ending up with extra screws and a crooked shelf. Taking ten minutes to read it will save you an hour of frustration.
Making the Matrix Work for You
The Matrix Option Infographic Presentation is a tool designed to simplify decision-making. It turns abstract options into visual comparisons. When used correctly, it helps your audience immediately grasp trade-offs and align on the best path forward.
The difference between a poor presentation and a great one often comes down to avoiding these simple mistakes. Resist the urge to dump data. Use the Master Slide to save time. Ensure your content actually fits a matrix framework. Embrace the empty space on the 16:9 canvas. Build a story, not just a collection of slides. And always, always prepare your fonts and images beforehand.
When you respect the structure of this template, it rewards you with efficiency and impact. You move from being someone who just "filled in a template" to someone who delivered a clear, compelling business case. That is the goal. That is what this tool is for. Use it with intention, and your audience will thank you.