Roadmap Infographic Template V1: A Guide to Using It Effectively Without Common Pitfalls
If you have ever needed to present a project timeline, a strategic plan, or a product launch sequence, you have likely faced the challenge of making complex information easy to follow. Roadmap infographics are a trusted solution, and Roadmap Infographic Template V1 offers a minimalistic design that promises clarity and flexibility. Many people download this template expecting instant results, but without a thoughtful approach, even a well-designed template can lead to confusion, wasted time, or a presentation that fails to communicate effectively.
Whether you are a marketer planning a campaign, a small business owner outlining quarterly goals, or an educator mapping a curriculum, using a template like this can save hours of work. But the key to success lies in understanding how to adapt it to your specific context, not simply filling in the blanks. This article walks through common mistakes people make with Roadmap Infographic Template V1 and offers practical advice to help you get the most out of it.
What Roadmap Infographic Template V1 Offers
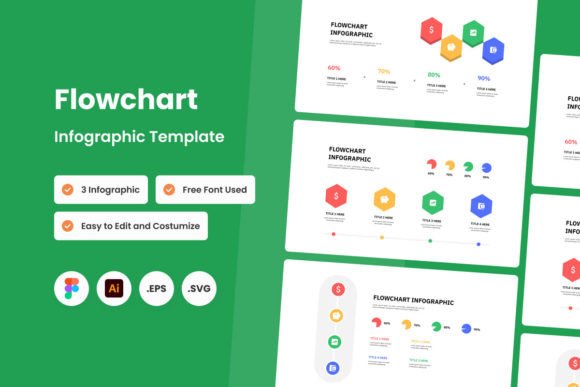
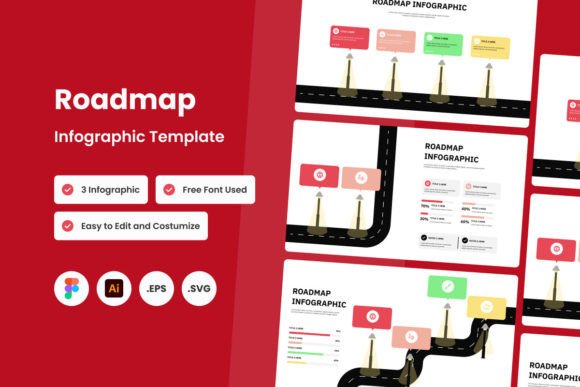
This template is designed to turn raw data and timelines into clean, visually appealing roadmaps. It comes in three unique design variations, so you are not stuck with a single look. The files are available in .Fig, .Ai, .Eps, and .Svg formats, giving you flexibility whether you work in Figma, Adobe Illustrator, or another vector tool. The use of open source fonts ensures that anyone can open and edit the files without licensing issues. All layers are neatly organized, which is a huge time-saver when you need to adjust colors, move elements, or swap out icons.
Yet, despite these well-thought-out features, people often run into problems because they overlook certain details or assume the template works like a one-size-fits-all solution. Avoiding these pitfalls will save you frustration and help you produce a roadmap that actually supports your communication goals.
Common Mistake 1: Not Customizing Beyond the Default Layout
One of the most frequent errors is treating the template as a final product rather than a starting point. You open the file, type in your milestones, and call it done. The result is a roadmap that looks generic and fails to reflect the unique timeline, priorities, or audience of your project. For example, if you are presenting to executives who care about high-level deliverables, a dense, step-by-step sequence will overwhelm them. Conversely, a team of developers might need granular detail about sprints and dependencies.
Better approach: Before you edit a single layer, step back and decide what story your roadmap needs to tell. Use the template’s structure as a scaffold, but do not hesitate to remove, add, or rearrange elements. Change the color scheme to match your brand or to highlight critical phases. Adjust the font sizes and spacing so that the most important information stands out. Roadmap Infographic Template V1’s neat layers make these changes straightforward, but you still need to make the choices.
Mistake 2: Choosing the Wrong File Format for Your Workflow
The template comes with four file formats, but not everyone needs all of them. Some people download every format and then use the wrong one, leading to missing fonts, broken layers, or time spent converting files. For instance, if you work primarily in Canva, you might find that the .Svg file imports well, but you lose some layer organization. Or if you try to open the .Ai file in an older version of Illustrator, you might see compatibility warnings.
How to avoid this: Take a moment to check which software you will use for editing. If you are a Figma user, the .Fig file is your best bet. If you prefer Adobe Illustrator, choose .Ai. For more universal compatibility, .Eps and .Svg work across many programs, but always test the file before investing hours of work. Also, remember that the images shown in the preview are not included in the file — this is easy to overlook if you are in a hurry. Plan to source your own icons or photos, or rely on the clean vector elements already inside the template.
Mistake 3: Ignoring the Need for Content Planning First
A surprising number of people open the template and start designing before they have decided what the roadmap actually needs to say. They end up squeezing too much text into a small space, or they leave large gaps that create a confusing visual flow. This happens especially when the project timeline is uncertain or when multiple stakeholders have competing priorities. The result is a roadmap that looks busy but communicates very little.
Practical advice: Write out your timeline, milestones, and key deliverables on a separate document or whiteboard before opening the template. Decide on the level of detail that matters most to your audience. For a quarterly business review, you might only need four high-level phases. For a product development cycle, you might need twelve steps with sub-items. Once you have a clear narrative, you can map it directly onto the three design variations available in Roadmap Infographic Template V1 and choose the one that best fits your content density.
Mistake 4: Overlooking the "Images Not Included" Warning
As noted in the template description, all images used in the preview are for demonstration only and are not part of the main file. This seems obvious, but many users download the template expecting to find the same icons, photos, or illustrations they saw in the preview. When those assets are missing, they either scramble to find replacements or use low-quality alternatives that reduce the overall professionalism of the roadmap.
Better approach: Treat the preview as a source of ideas, not a resource. Plan ahead for the visual elements you will need. If you want icons, look for free icon sets that match the minimalist style of the template. If you need photos, consider using your own product shots or sourcing from free stock photo sites that require no attribution. Because the template uses open source fonts, at least you will not face licensing issues on that front. By preparing your visuals in advance, you can keep the design consistent and clean.
Mistake 5: Using the Wrong Design Variation for Your Audience
Roadmap Infographic Template V1 offers three unique designs, but not every variation suits every context. The minimalist approach means differences are subtle, but they can matter. One variation might be more horizontal, while another uses a vertical flow or a curved path. If you are presenting on a widescreen monitor, a horizontal layout often works better. If your content is meant for a printed handout or a mobile screen, a vertical or compact design might be more effective.
How to choose: Review all three variations with your actual content in mind. Test each one by inserting a few sample milestones. Notice how the eye moves across the page and whether the arrangement supports your timeline’s narrative. Do not default to the first variation that looks attractive. Take advantage of the flexibility the template offers, and pick the structure that makes your data easiest to follow. This small decision can dramatically improve how well your audience retains the information.
Mistake 6: Neglecting the Layer Organization for Future Edits
One of the stated features is "Neat Layers," and this is genuinely helpful — but only if you preserve that organization. Many users, in the rush to customize, start moving elements around, renaming layers arbitrarily, or merging groups. Later, when they need to update the roadmap for a new quarter or a different project, they find a chaotic file that is harder to edit than starting from scratch.
Practical tip: Keep the original layer structure intact as much as possible. If you need to add new elements, create new layers with clear names that follow the template’s naming convention. Use the same hierarchy so that you can always find the background, text, icons, and connectors. This discipline pays off when you need to make quick changes later, especially if you share the file with a colleague who is not familiar with your modifications.
How to Get the Most from Roadmap Infographic Template V1
To summarize the best practices: start by planning your content outside the template, choose the file format that matches your editing software, and review all three design variations before committing to one. Be prepared to supply your own images and icons, and take advantage of the neat layers by keeping them organized. Customize freely but with intention, always thinking about what your specific audience needs to understand.
This template is a powerful tool because it removes the burden of starting from a blank canvas. However, the real value comes from how you adapt it to your story. Avoid the common mistakes of treating it as a finished product, ignoring the file format nuances, or neglecting content planning. When you use Roadmap Infographic Template V1 thoughtfully, you turn a simple infographic into a strategic communication asset that clarifies your project, impresses stakeholders, and saves you time in the long run.
If you are ready to give this template a try, download the full file package and take a few minutes to explore each variation. Set aside time for planning before you start designing, and remember that the images in the preview are for inspiration only. With these practices in place, your roadmap will not only look professional — it will actually do its job of guiding your audience through your plan.