Flowchart Infographic Template V2: A Practical Guide to Evaluating Its Fit for Your Data Visualization Needs
When you need to communicate a process, a decision tree, or a sequence of steps clearly, the right visual framework makes all the difference. Flowchart Infographic Template V2 is designed to help professionals turn structured data into clear, engaging visuals without starting from scratch. This article examines what this template offers, how it compares to other approaches, and how to decide whether it suits your particular project.
What Flowchart Infographic Template V2 Offers
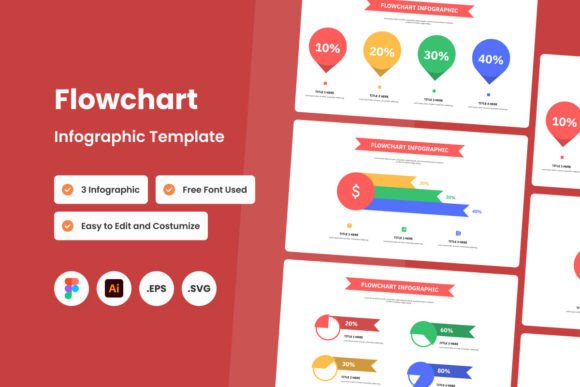
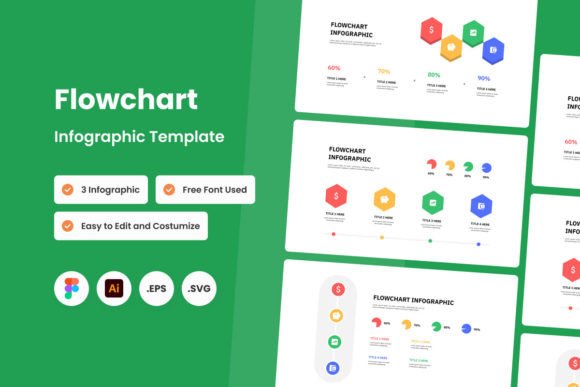
At its core, this template provides a modern, dynamic layout for building flowchart-style infographics. It is aimed at professionals preparing presentations, reports, or marketing materials who value both clarity and visual appeal. The template includes three unique design variations, giving you some creative flexibility without overwhelming you with too many choices.
Each design is organized with neat layers, which means you can adjust colors, text, or graphic elements without disturbing the rest of the layout. This layered structure is particularly helpful when you are working on a tight deadline or collaborating with a team. The template also relies on open source fonts, so you do not need to purchase or manage proprietary typefaces.
File formats include .Fig, .Ai, .Eps, and .Svg, covering the most common vector editing and design workflows. Whether you use Figma, Adobe Illustrator, Inkscape, or another compatible application, you can open and edit the template directly.
How This Template Compares to Other Visualization Approaches
Choosing between Flowchart Infographic Template V2 and other methods depends on your priorities, timeline, and skill level. Below are common alternatives and how they stack up.
Starting from a Blank Canvas
Designing a flowchart manually in a vector or presentation tool gives you full creative control. You are not limited by someone else’s layout choices, and you can adapt the design exactly to your brand or message. However, this approach demands more time, design experience, and attention to detail. If you lack a strong design background or have a tight turnaround, starting from nothing can lead to inconsistencies or a less polished final result.
Flowchart Infographic Template V2 provides a structured starting point. You still customize it heavily, but the layout, spacing, and visual hierarchy are already thought through. This can save hours of trial and error.
Using Basic Built-in Templates in Presentation Software
PowerPoint, Google Slides, and Keynote offer basic diagram tools. These are convenient, familiar, and already integrated into your workflow. However, their flowchart options are often limited in design flexibility and polish. You may end up with something that looks generic or dated, especially if your audience expects a more modern, professional visual.
The V2 template, in contrast, offers a contemporary aesthetic with more refined typography, iconography alignment, and color harmony. It helps your work stand out in presentations where visual quality matters.
Working with Other Premium Infographic Templates
Many template marketplaces offer infographic kits with flowchart elements. Some include dozens of design variations and extensive icon libraries. The tradeoff is that more complex kits can be harder to navigate and customize, especially if the layers are not well organized.
Flowchart Infographic Template V2 keeps things focused. With three distinct designs and neatly organized layers, you can find and adjust what you need quickly. If you prefer simplicity and clarity over a massive feature set, this template may feel more manageable.
Strengths of Flowchart Infographic Template V2
- Design quality. The template offers a modern, clean look that fits professional and corporate contexts. The three variations give you options while maintaining visual consistency.
- Ease of customization. Because elements are organized in neat layers, you can replace text, adjust colors, and swap visuals without breaking the layout. This is especially useful if you are not a design expert.
- File format flexibility. The inclusion of .Fig, .Ai, .Eps, and .Svg means you can work in your preferred vector editing environment. This reduces the learning curve and makes collaboration easier.
- Open source fonts. No additional licensing costs or font compatibility issues. This is a practical advantage for teams that share files across different machines or need to adhere to budget constraints.
- Focused scope. Instead of offering hundreds of templates that can be overwhelming, this product includes three well-crafted designs. For many users, this reduces decision fatigue and speeds up the production process.
Tradeoffs and Limitations to Consider
No template is perfect for every situation. Understanding where Flowchart Infographic Template V2 may fall short helps you decide if it is the right fit.
- Limited design variety. Three variations are enough for many projects, but if you need a highly distinctive look or a very specific diagram structure, you might find the options too narrow. In that case, a larger template pack or a custom design could serve you better.
- No included imagery. The template’s preview images are for illustration only. You will need to source your own icons, photos, or graphics if you want to go beyond the built-in shapes and placeholders. This is common among template products, but it is worth factoring into your budget and timeline.
- Requires vector editing software. While the file formats are widely compatible, you still need software that can open .Ai, .Eps, .Svg, or .Fig files. If you rely only on basic office tools, you may need to learn a new application or convert files, which could add friction.
- Learning curve for layers. Even with well-organized layers, users unfamiliar with vector editing may feel overwhelmed at first. A short learning investment is usually enough, but it is not zero.
- No text-heavy adaptation. Flowchart infographics are inherently visual. If your content is highly textual or data-dense, you may need to supplement the template with more traditional chart formats or break the content into multiple pages.
When Flowchart Infographic Template V2 Is the Right Choice
This template tends to work well in the following scenarios:
- Professional presentations. If you are preparing slides for a client meeting, internal review, or conference, the template gives your flowcharts a polished, modern appearance that enhances credibility.
- Reports and proposals. Embedding clear flowcharts in a PDF or printed report helps readers quickly grasp processes or decision paths. The template’s clean layout supports easy reading.
- Marketing collateral. For one-pagers, infographics for social media, or landing page visuals, the modern design draws attention while keeping information organized.
- Teams without dedicated designers. If you rely on subject matter experts who are not design specialists, the template reduces the gap between raw ideas and finished visuals.
- Time-sensitive projects. When you need a high-quality flowchart quickly, starting from this template is far faster than designing from scratch or learning complex diagramming software.
When You May Need a Different Option
There are also situations where Flowchart Infographic Template V2 may not be the best fit:
- Highly specialized diagrams. If your flowchart requires custom symbols, complex branching logic, or technical notation (for example, in engineering or software development), a dedicated diagramming tool like draw.io, Lucidchart, or Visio might be more appropriate. These tools offer features like automatic layout, data linking, and extensive shape libraries.
- Extensive branding requirements. If your organization has very specific visual guidelines that go beyond what the template can accommodate with simple color and font changes, you might need a custom design that starts from your brand system.
- Collaborative real-time editing. The template works well for individual or asynchronous editing in vector software. If your team needs to collaborate simultaneously on a flowchart, web-based diagramming tools with real-time co-authoring may serve you better.
- Budget constraints for software. While the template itself is affordable, the vector editing software needed to customize it may represent an additional cost. If you are working with free tools only, check compatibility with .Svg or .Fig formats beforehand.
Practical Decision Factors to Weigh
Before committing to Flowchart Infographic Template V2 or an alternative, consider these questions:
- What is your audience’s expectation for visual quality? For internal team updates, a basic diagram might suffice. For client-facing or public-facing materials, the polished design of this template adds value.
- How much time can you invest in customization? The template reduces layout time, but you still need to adapt content, choose colors, and refine details. Estimate whether this fits your schedule.
- What tools does your team already use? If your workflow is built around Figma or Adobe Creative Suite, the template integrates seamlessly. If you rely entirely on Google Workspace or Microsoft Office, consider whether the additional software step is acceptable.
- How complex is your data? Simple sequential processes or decision trees work well with this template. Highly branching or interconnected diagrams may require a more flexible approach or multiple connected pages.
- Do you need unique visuals for each project? If you create flowcharts frequently and want each to feel distinct, the three design variations may feel repetitive over time. You could mix the variations or use them as a starting point for further customization.
Getting the Most Out of the Template
If you decide that Flowchart Infographic Template V2 fits your needs, a few practices can help you maximize its potential:
- Start with a clear outline. Map out your content, hierarchy, and flow before opening the template. This ensures you choose the variation that best supports your structure.
- Replace placeholder text early. Work with real content as soon as possible to check fit, readability, and flow. This prevents last-minute surprises.
- Use consistent colors and fonts. Even though the template provides a default palette, align it with your brand guidelines for a professional finish.
- Simplify where possible. Flowcharts communicate best when they are not overloaded. Edit ruthlessly to keep only essential steps and decisions.
- Test readability at different sizes. Check your flowchart on a projector, a printed page, and a mobile screen if relevant. Adjust font sizes and spacing accordingly.
Final Thoughts on Evaluating Flowchart Infographic Template V2
Flowchart Infographic Template V2 offers a balanced combination of modern design, customization ease, and practical file support. It is a strong choice for professionals who need a polished visual quickly and who have access to vector editing tools. At the same time, it is not a universal solution. Understanding its strengths and limitations, compared to both minimal tools and more specialized software, helps you decide whether it aligns with your specific project requirements, team capabilities, and quality standards.
Whether you select this template or another approach, the most important factor is how well your final visual serves its purpose: helping your audience understand a process or decision with clarity and confidence. By weighing the tradeoffs and matching the tool to the task, you can make a more informed decision and produce visuals that truly support your message.